reshape2와 plyr은 데이터를 다양한 구조로 가공하는데 사용되는 라이브러리이다.
(데이터 마트를 구현하는데 사용데 필요한 다양한 기능이 구현)
library(reshape2, plyr)
plyr::colwise(column-wise function)
return a function that operates on a vector into a function
that operates column-wise on a data.frame
데이터 프레임의 일반 변수를 적용할 수 있는 함수를 반환한다.
rescale(표준화)
rescale01<-function(x){
return((x-min(x))/diff(range(x)))
}
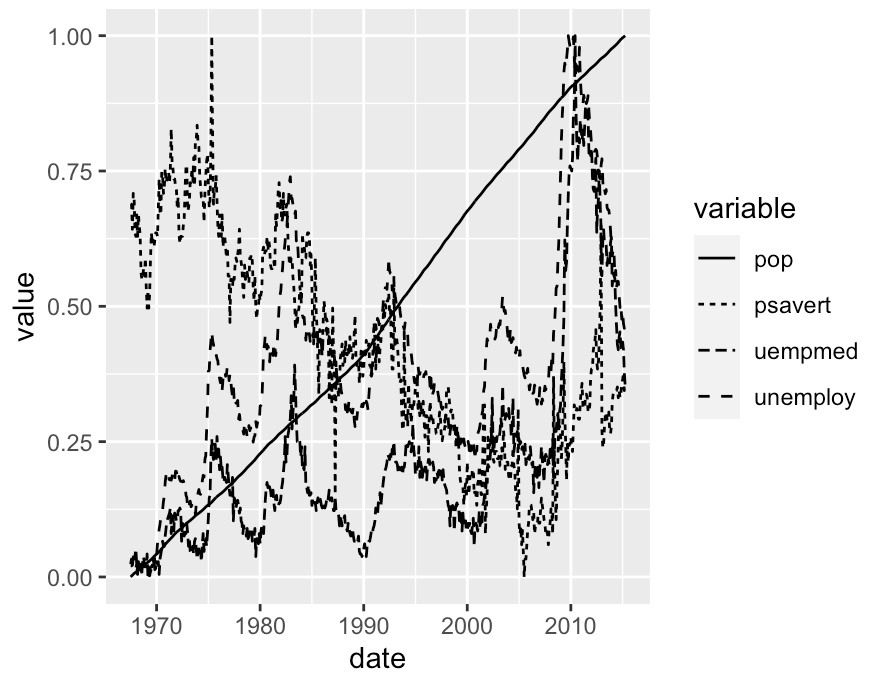
ec_scaled<-data.frame(date=economics$date, colwise(rescale01)(economics[, -(1:2)]))
ecm<-melt(ec_scaled, id="date")
그래프 생성
f<-ggplot(ecm, aes(date, value))
f+geom_line(aes(linetype=variable))
히스토그램
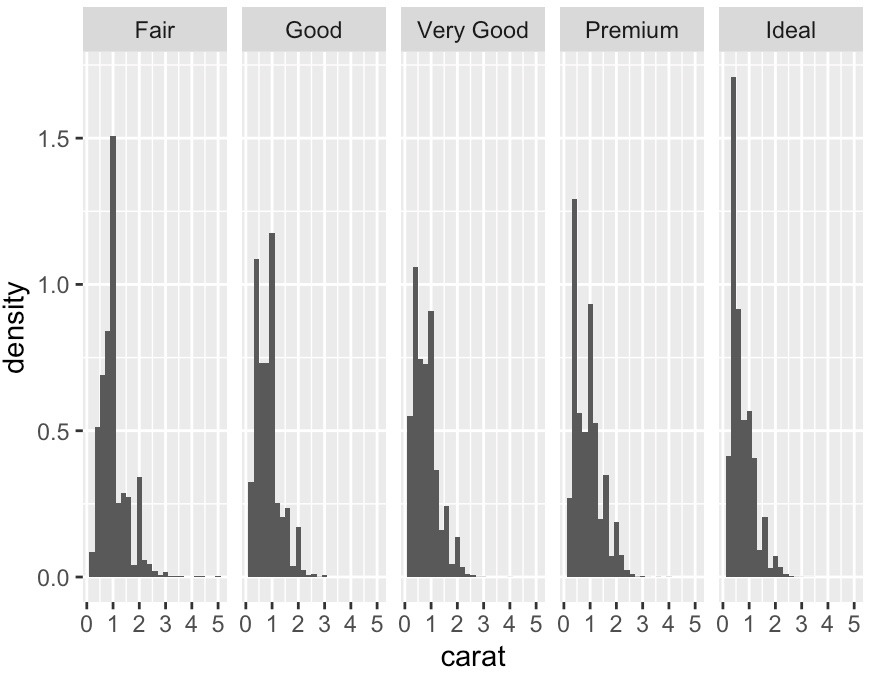
data(diamonds)
k<-ggplot(diamonds, aes(carat, ..density..))+geom_histogram(binwidth=.2)
k+facet_grid(.~cut)
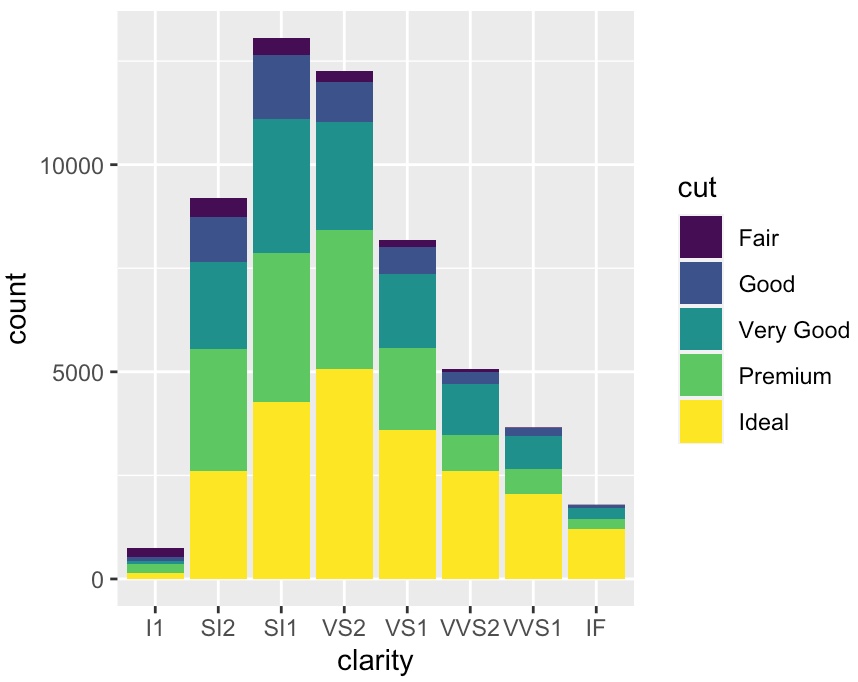
w<-ggplot(diamonds, aes(clarity, fill=cut))
w+geom_bar(aes(order=desc(cut)))
plyr::desc(Descending order)
Transform a vector into a format that will be sorted in descending order
선그래프
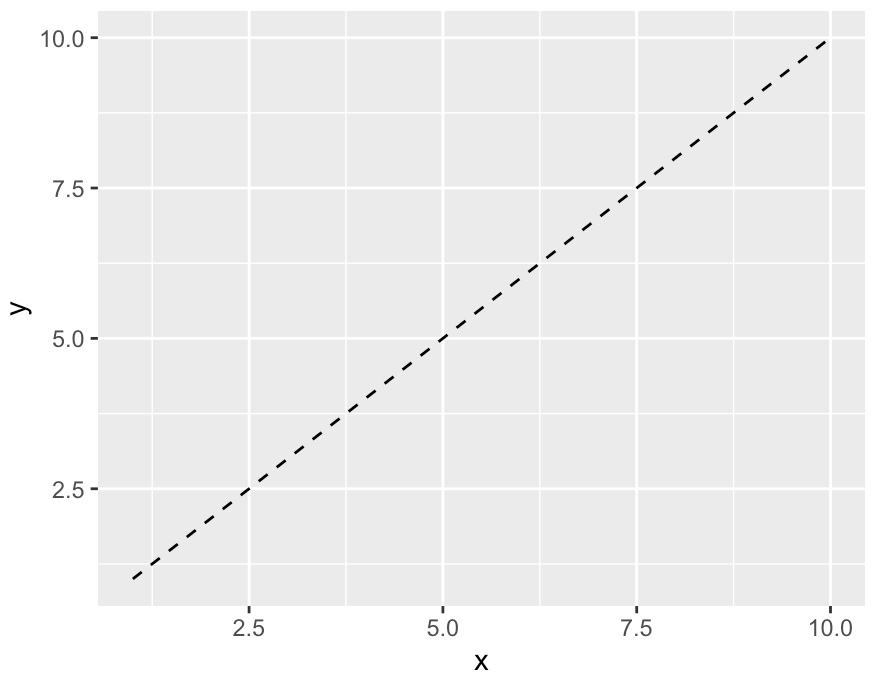
df<-data.frame(x=1:10, y=1:10)
f<-ggplot(df, aes(x=x, y=y))
f+geom_line(linetype=2)
# same as geom_line(linetype="dotdash")
포인트 그래프
p<-ggplot(mtcars, aes(wt, mpg))
p+geom_point(aes(size=qsec))

임의의 선 추가
geom_hline()
yintercept
size
slope
geom_vline()
xintercept
size
slope
p+geom_point(size=2.5)+geom_hline(yintercept=25, size=3.5)

p+geom_point(shape=5)
p+geom_point(shape="k", size=3)
# p+geom_point(shape=".")
# p+geom_point(shape=NA)


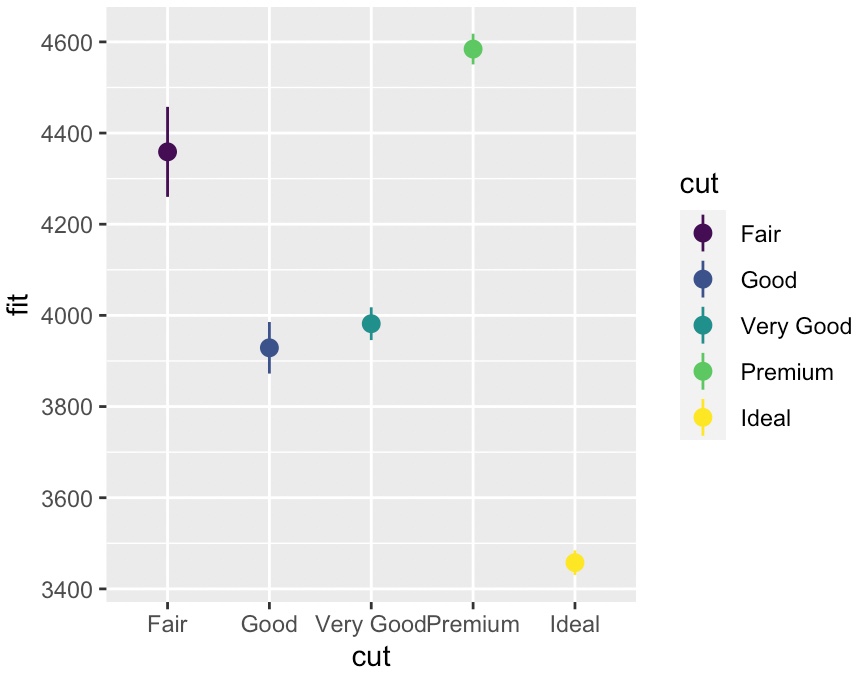
Linear Model with geom_pointrange()
diamonds$cut<-factor(diamonds$cut, order=F) # 참고
dmod<-lm(price~cut, data=diamonds)
cuts<-data.frame(cut=unique(diamonds$cut), predict(dmod, data.frame(cut=unique(diamonds$cut)), se=TRUE)[c("fit", "se.fit")])
se<-ggplot(cuts, aes(x=cut, y=fit, ymin=fit-se.fit, ymax=fit+se.fit, col=cut))
se+geom_pointrange()
diamonds$cut은 order 변수이다. 이를 lm 처리할 경우, coefficient가 다르게 나왔다.
하지만, predict를 통해서 연산한 결과는 동일했음…
ordered category를 이용한 lm 에서 생성된 변수
cut.L, cut.Q, cut.C, cut^4 에서
L은 Linear trend, Q는 Quadratic trend, C는 Cubic trend를 의미한다.
R에서 ordered factors를 이용한 경우, default로
R fits a series of polynomial functions to the levels of variable
강조 박스(annotate)
p<-ggplot(mtcars, aes(wt, mpg))+geom_point()
p+annotate("rect", xmin=2, xmax=3.5, ymin=2, ymax=25, fill="dark grey", alpha=0.5)

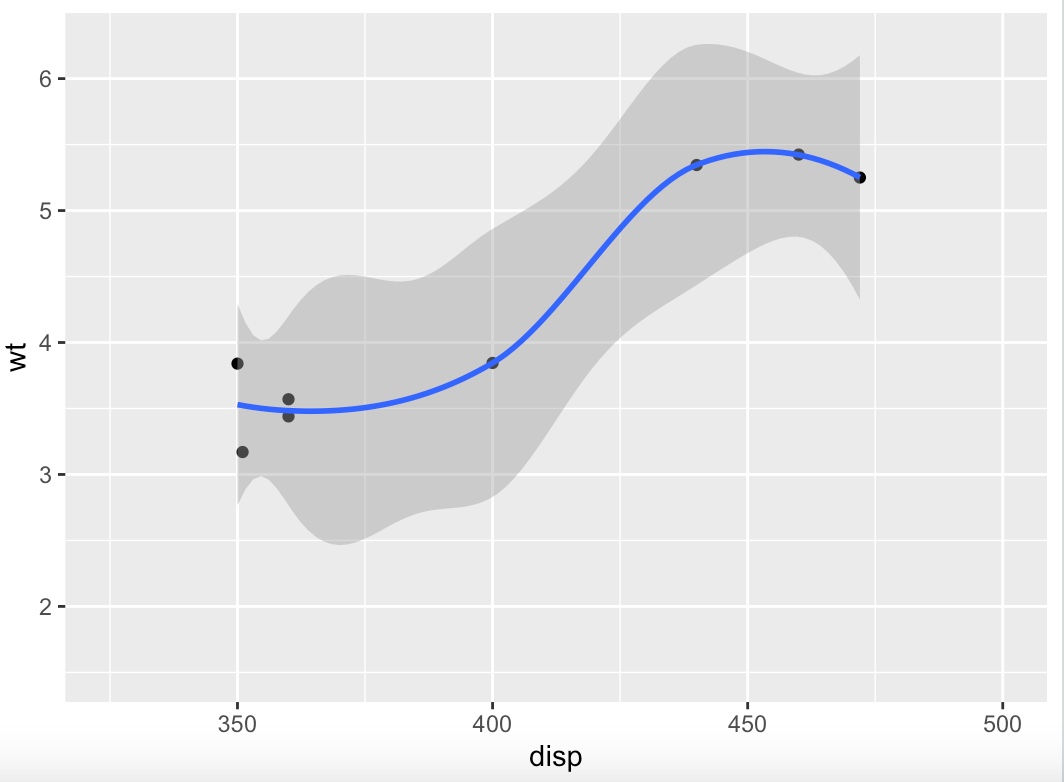
스무스 그래프(geom_smooth)
`geom_smooth()` using method = 'loess' and formula 'y ~ x'
p<-qplot(disp, wt, data=mtcars)+geom_smooth()

x 범위 지정(scale_x_continuous)
coord_cartesian(xlim) // 단순 그래프 축 확대
scale_x_continuous(limits) // 해당 범위에서 그래프 분석(히스토그램 등의 최대값 범위내로 변경)
p+scale_x_continuous(limits=c(325, 500))
stat_bin2d
d<-ggplot(diamonds, aes(carat, price))
d<-d+stat_bin2d(bins=25, colour="grey50")
d+scale_x_continuous(limits=c(0, 2))
boxplot( qplot(geom=“boxplot”) )
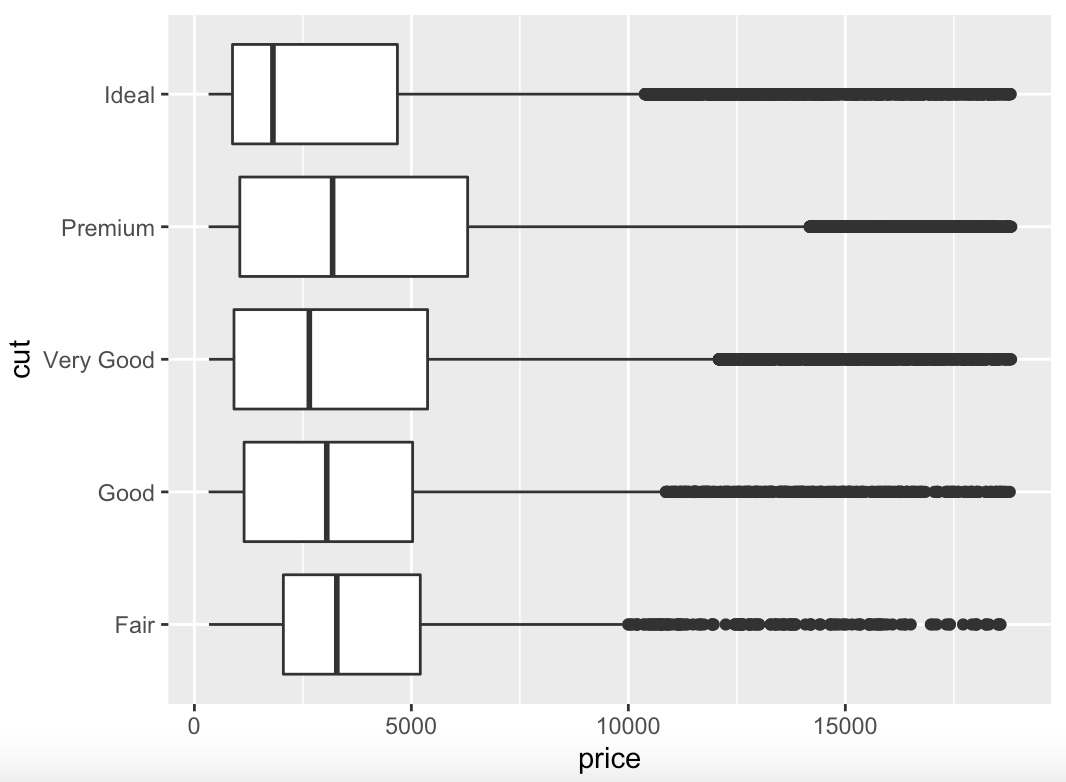
qplot(cut, price, data=diamonds, geom="boxplot")

가로로 X-Y축 변환(coord_flip)
coord_flip: 하나의 그래프에서 X-Y축 변환
facet_grid: 면분할 그래프에서 축 설정
last_plot()+coord_flip()
